Visualizing Sensor Data
Enhancing the Helgoland Sensor Web Viewer
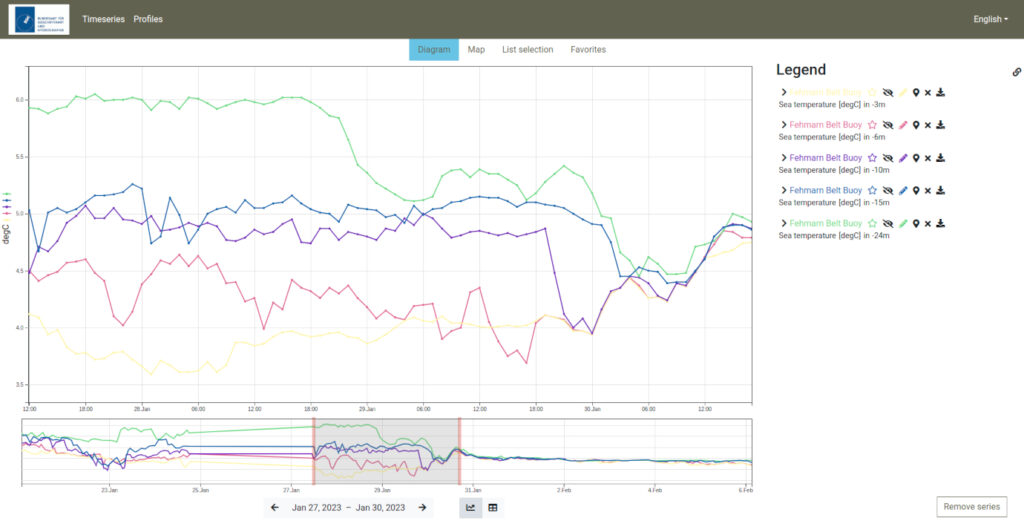
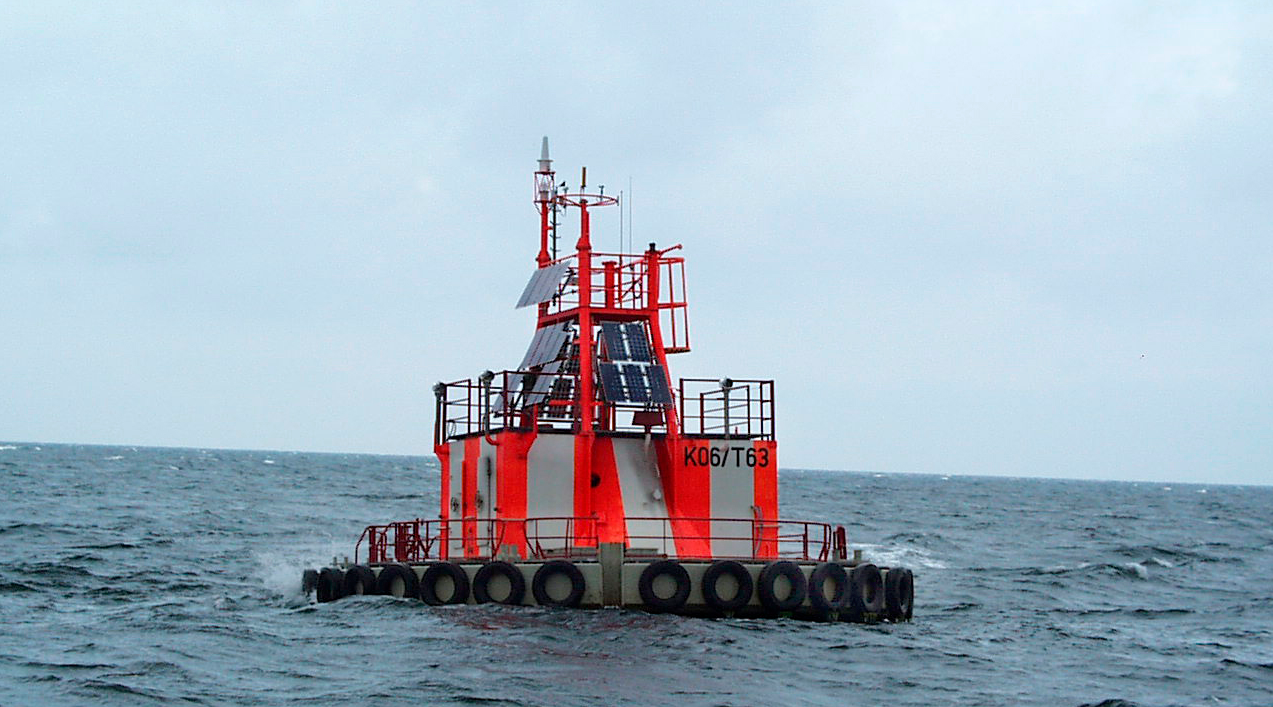
The German Federal Maritime and Hydrographic Agency (BSH) operates several measurement platforms and project stations in the North and Baltic Seas. These platforms measure a range of parameters at different depth and height levels. Once a year, a ship approaches the stations to measure profiles of a range of parameters. To enable the interoperable exchange of the measured observation data, the BSH previously ran an instance of the 52°North Sensor Observation Service (SOS) implementation that was fed by an FME process (using the transactional SOS operations). The BSH has enhanced its infrastructure with a SensorThings API server and client components that allow exploration and visualization of the available observation data. The 52°North’s Helgoland Sensor Web Viewer is used for this purpose.
The main task of this project is to extend the Sensor Web Viewer to support profile data and to harmonize the presentation of time series and profile data. Special emphasis was placed on improving the usability of the viewer and adding a convenient approach for selecting profile data for visualization.

