Drought Crop Impact Indicator Workflow
Supporting the decision-making for adaptation to climate change
OGC DP23 aims to reduce the risk of climate hazards and to adapt to climate change. The designated research areas are in Manitoba, Canada, and California, USA, with their major climate hazards of droughts, floods and wildfires, respectively. Some deliverables focus on ways to improve the work of first responders and the health impacts of both disasters and climate change. All deliverables will use the latest OGC APIs and try to contribute to a modular workflow chain from Analysis Ready Data (ADR) to Decision Ready Indicators (DRI). The idea behind this is to transform primary data sources as provided by NASA, Canadian Met Service and Copernicus, e.g. , remote sensing or atmospheric data (ADR), with models and processes until they answer a very specific question (DRI). With the modular approach, the pilot aims to connect different workflows; for example, the intermediate result of one workflow could be the starting point (ADR) for another workflow.
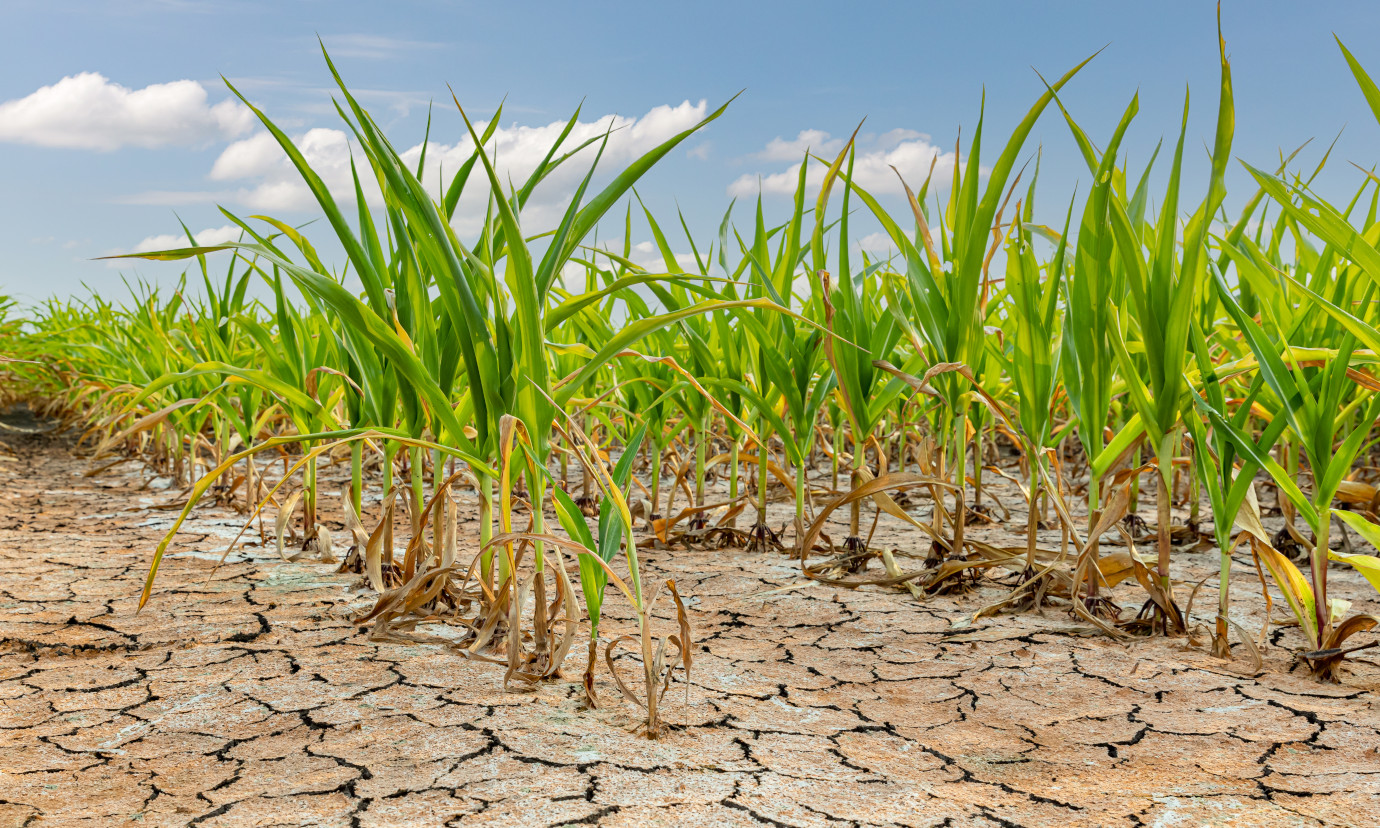
52°North focused on an indicator showing the impact of drought on various crops in the Manitoba region. In addition to financial losses for commercial farmers, droughts can severely impact indigenous communities that rely on harvesting their own crops for food security. A tool that compares different crop fitness levels with respect to drought stress could help in the decision-making process of finding the right crops to adapt to climate change.
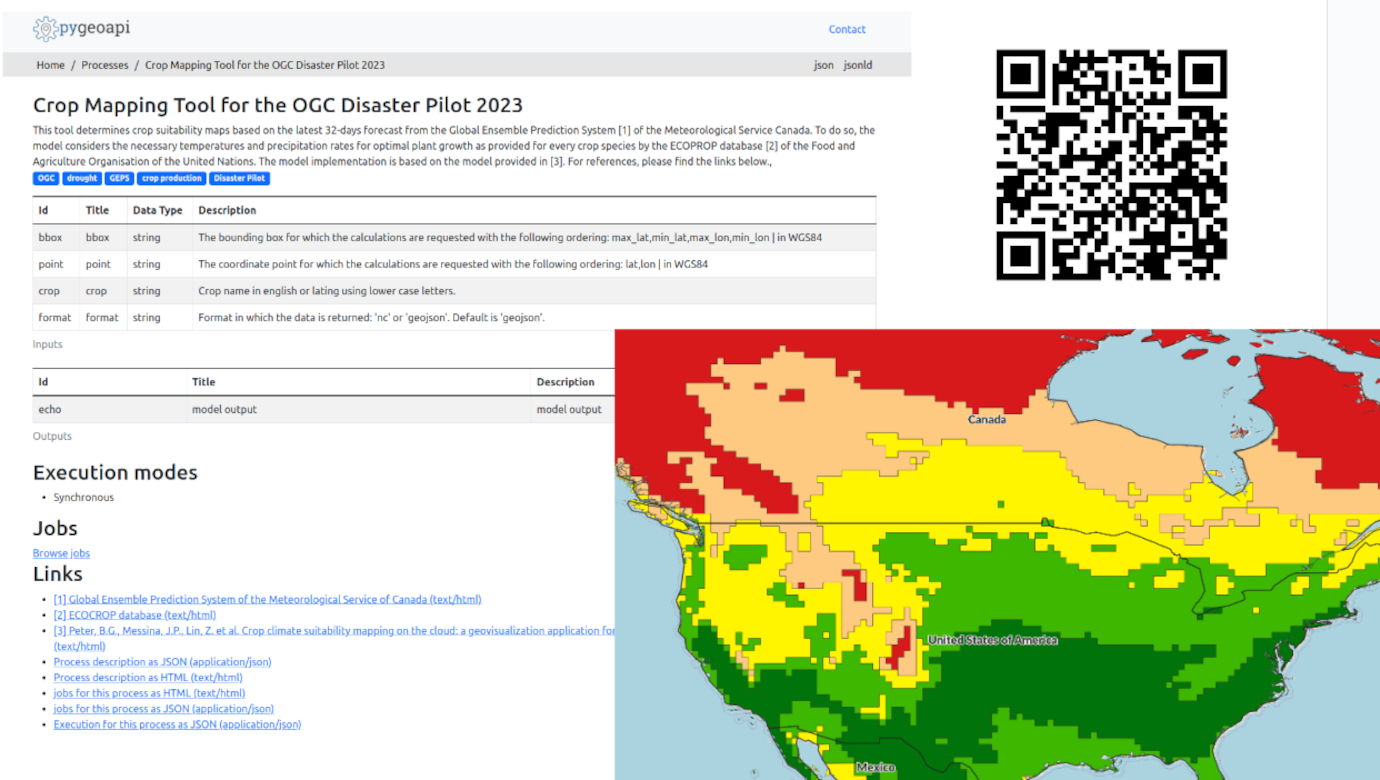
To create this indicator, we used 30-day temperature and precipitation forecasts provided by the Canadian Met Service and fed them into the crop suitability model (Peter et al., 2020) using plant requirements for temperature and precipitation. The forecast is downloaded weekly and preprocessed (averaging across the different members of the ensemble model). Users receive a NetCDF file or a vectorized representation using contour polygons if they request a bounding box with categories of potential plant growth ‘marginal’ – ‘optimal’ for a given crop. Additionally, users can specify a point instead of a bounding box and will receive the plant growth category in a JSON format.

