Web-Based Visualization of Observation Data
Enabling exploration, analysis and visualization of sensor web data
The Helgoland Suite comprises two software packages to support the exploration, visualization, and analysis of Sensor Web data. The main component is the Sensor Web Viewer, which is built upon the Helgoland Toolbox.
The Sensor Web Viewer is a lightweight web application that enables users to:
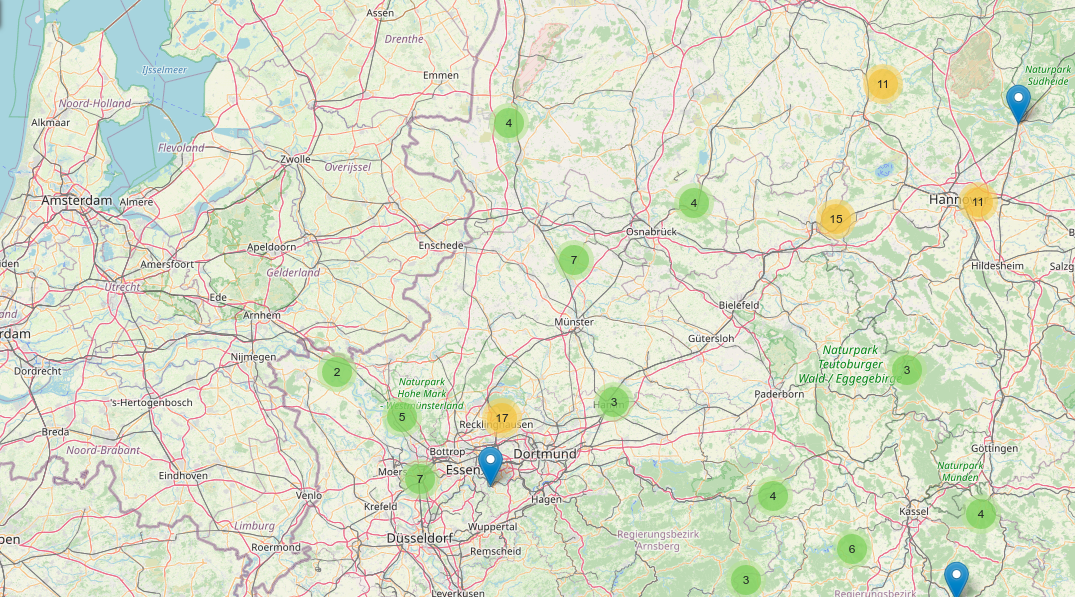
- Explore stations or mobile sensor platforms in a map
- Select time series data via a list selection
- Visualize and navigate through time series data, trajectory data, profile measurements
- Create favorites of selected time series
- Export visualized data as CSV files.
It can connect to different Sensor Web endpoints (via the 52°North Helgoland API). These endpoints provide a thin access layer to sensor data via a RESTful Web binding with different output formats. In addition, the Viewer can also connect to OGC SensorThings API instances.
Our Sensor Web Viewer is based on the Helgoland Toolbox, which integrates the different toolbox modules into a viewing application that can be easily customized according to the requirements of specific users.
The most important functional modules comprise:
- Core
- Communication with the APIs (Helgoland API and OGC SensorThings API)
- Important common services (local storage, time)
- Central interfaces and abstract classes
- Caching
- Request Caching with Angular Interceptors
- d3
- Trajectory Graph component
- Time series Graph component
- Depiction
- Legend entries
- Table view of data
- Map
- Controls (Geo-Search, Locate, Zoom, Extent)
- Map Selector component
- Selectors
- List Selector for observation data
- Service Selector for data sources.

Benefits
Viewer
- Lightweight, Web-based visualization of observation data
- Exploration of Sensor Web data sources (SOS, SensorThings API)
- Support of different types of observation data (time series, trajectories, profiles)
- Data download (CSV)
Toolbox
- Reusable components for building client applications
- Modules for visualizing different types of sensor data (time series, trajectories, profiles)
- Mapping modules
- Different components for data selection
Fields of Application
Hydrology, air quality, marine sciences, environmental monitoring
Project References
Viewer
- Federal Maritime and Hydrographic Agency (BSH), Germany
- Wupperverband, Germany
- SeaDataCloud
- WaCoDiS
- MuDak-WRM
Toolbox