Visualizing Sensor Data
Enhancing the Helgoland Sensor Web Viewer
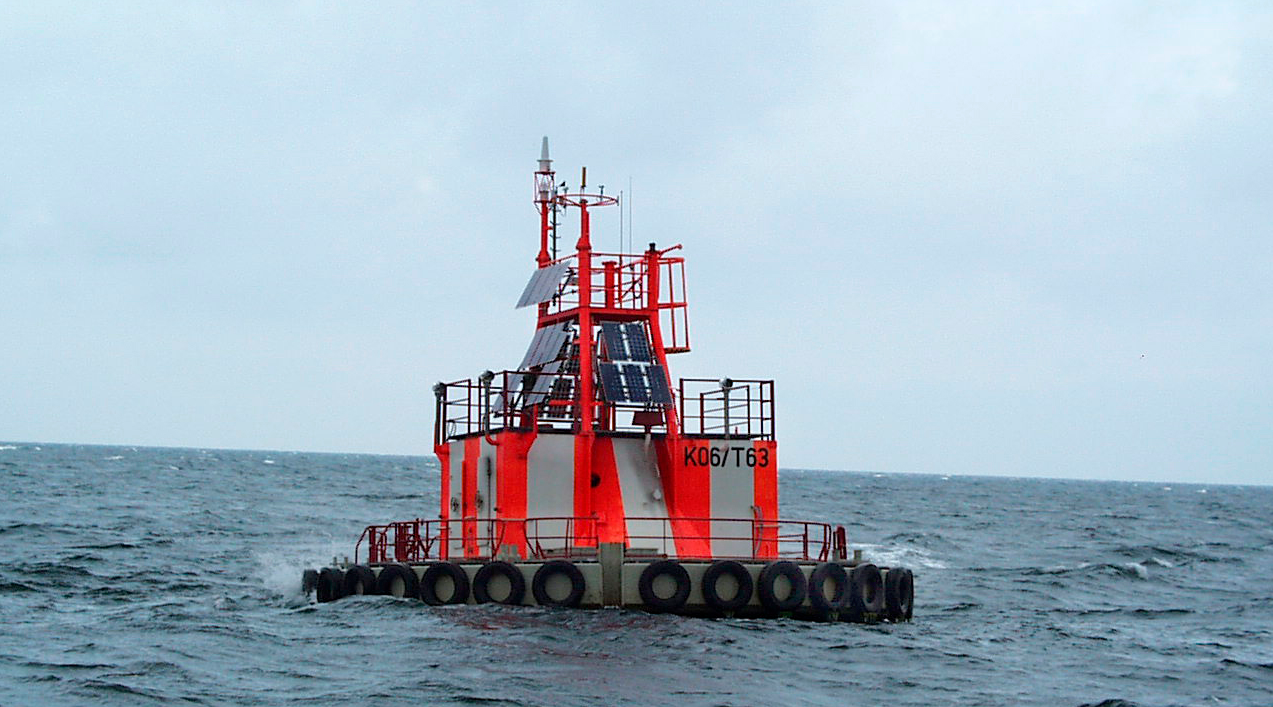
The German Federal Maritime and Hydrographic Agency (BSH) operates several measurement platforms in the North and Baltic Seas. These stations measure a range of parameters at different depth and height levels. To enable the interoperable exchange of the measured observation data, the BSH previously ran an instance of the 52°North Sensor Observation Service (SOS) implementation that was fed by an FME process (using the transactional SOS operations). The BSH has enhanced its infrastructure with client components that allow exploration and visualization of the available observation data. Both 52°North’s Helgoland Sensor Web Viewer and con terra’s map.apps (GeoSeaPortal App) are used for this purpose.
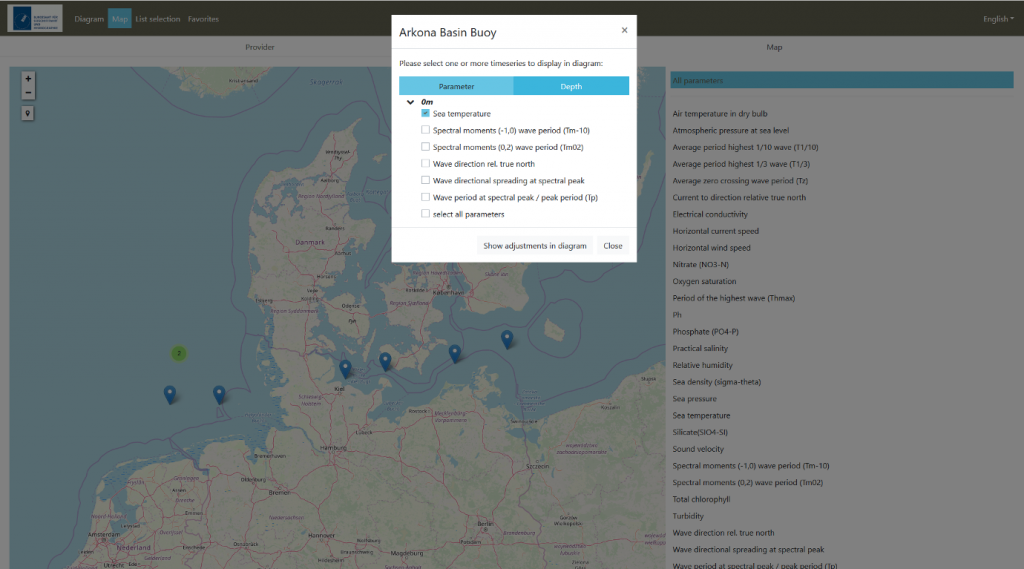
Handling the rather large number of depth/height levels at which the stations measure data proved to be a major challenge. The data selection workflow became impractical when using the common versions of map.apps and the Helgoland Sensor Web Viewer. Thus, the main tasks of this project comprised two activities. As a first step, 52°North developed an approach for expressing different depth/height levels as additional information and filter criteria in the OGC SOS and the 52°North Sensor Web REST API data models. We then developed a corresponding mapping that BSH applied in their FME data import processes.
In a second step, the Helgoland Sensor Web Viewer and con terra’s map.apps were extended so that they can use the additional depth/height information during the data selection and visualization process. This resulted in an increased level of user-friendliness in the two Sensor Web viewing tools. 52°North’s responsibilities covered all aspects related to data modelling. In addition, 52°North enhanced the Helgoland Sensor Web Viewer accordingly.

Project Partner
con terra GmbH, 52°North was a con terra subcontractor
