
Choosing the best Visualization Approaches
User-friendly and efficient visualization of spatio-temporal data available via the mCLOUD
The Federal Ministry of Transport and Digital Infrastructure (BMVI) initiated the mCLOUD as a common open data discovery portal. This portal improves the discoverability of their open data and those of its related projects and agencies.
In order to facilitate the efficient and user-friendly exploration of available data sets, it is essential to visualize the data as quickly and easily as possible. Fast and informative visualization of open data from the mCLOUD remains difficult, especially for spatiotemporal data. Usually, users must download and convert this data into common data formats before visual exploration is possible.
mVIZ conducted a preliminary study to develop a methodology that supports the selection and creation of user-friendly visualizations for data discoverable via the mCLOUD. The resulting guidelines describe the methodology and serve as a basis for the conception, extension or improvement of visualization tools or their further development and integration into open data portals. The project focused particularly on
- the creation of an inventory of open spatio-temporal data in mCLOUD as well as an overview of available visualization and analysis tools
- the development of a methodology for selecting appropriate visualizations for the spatio-temporal data
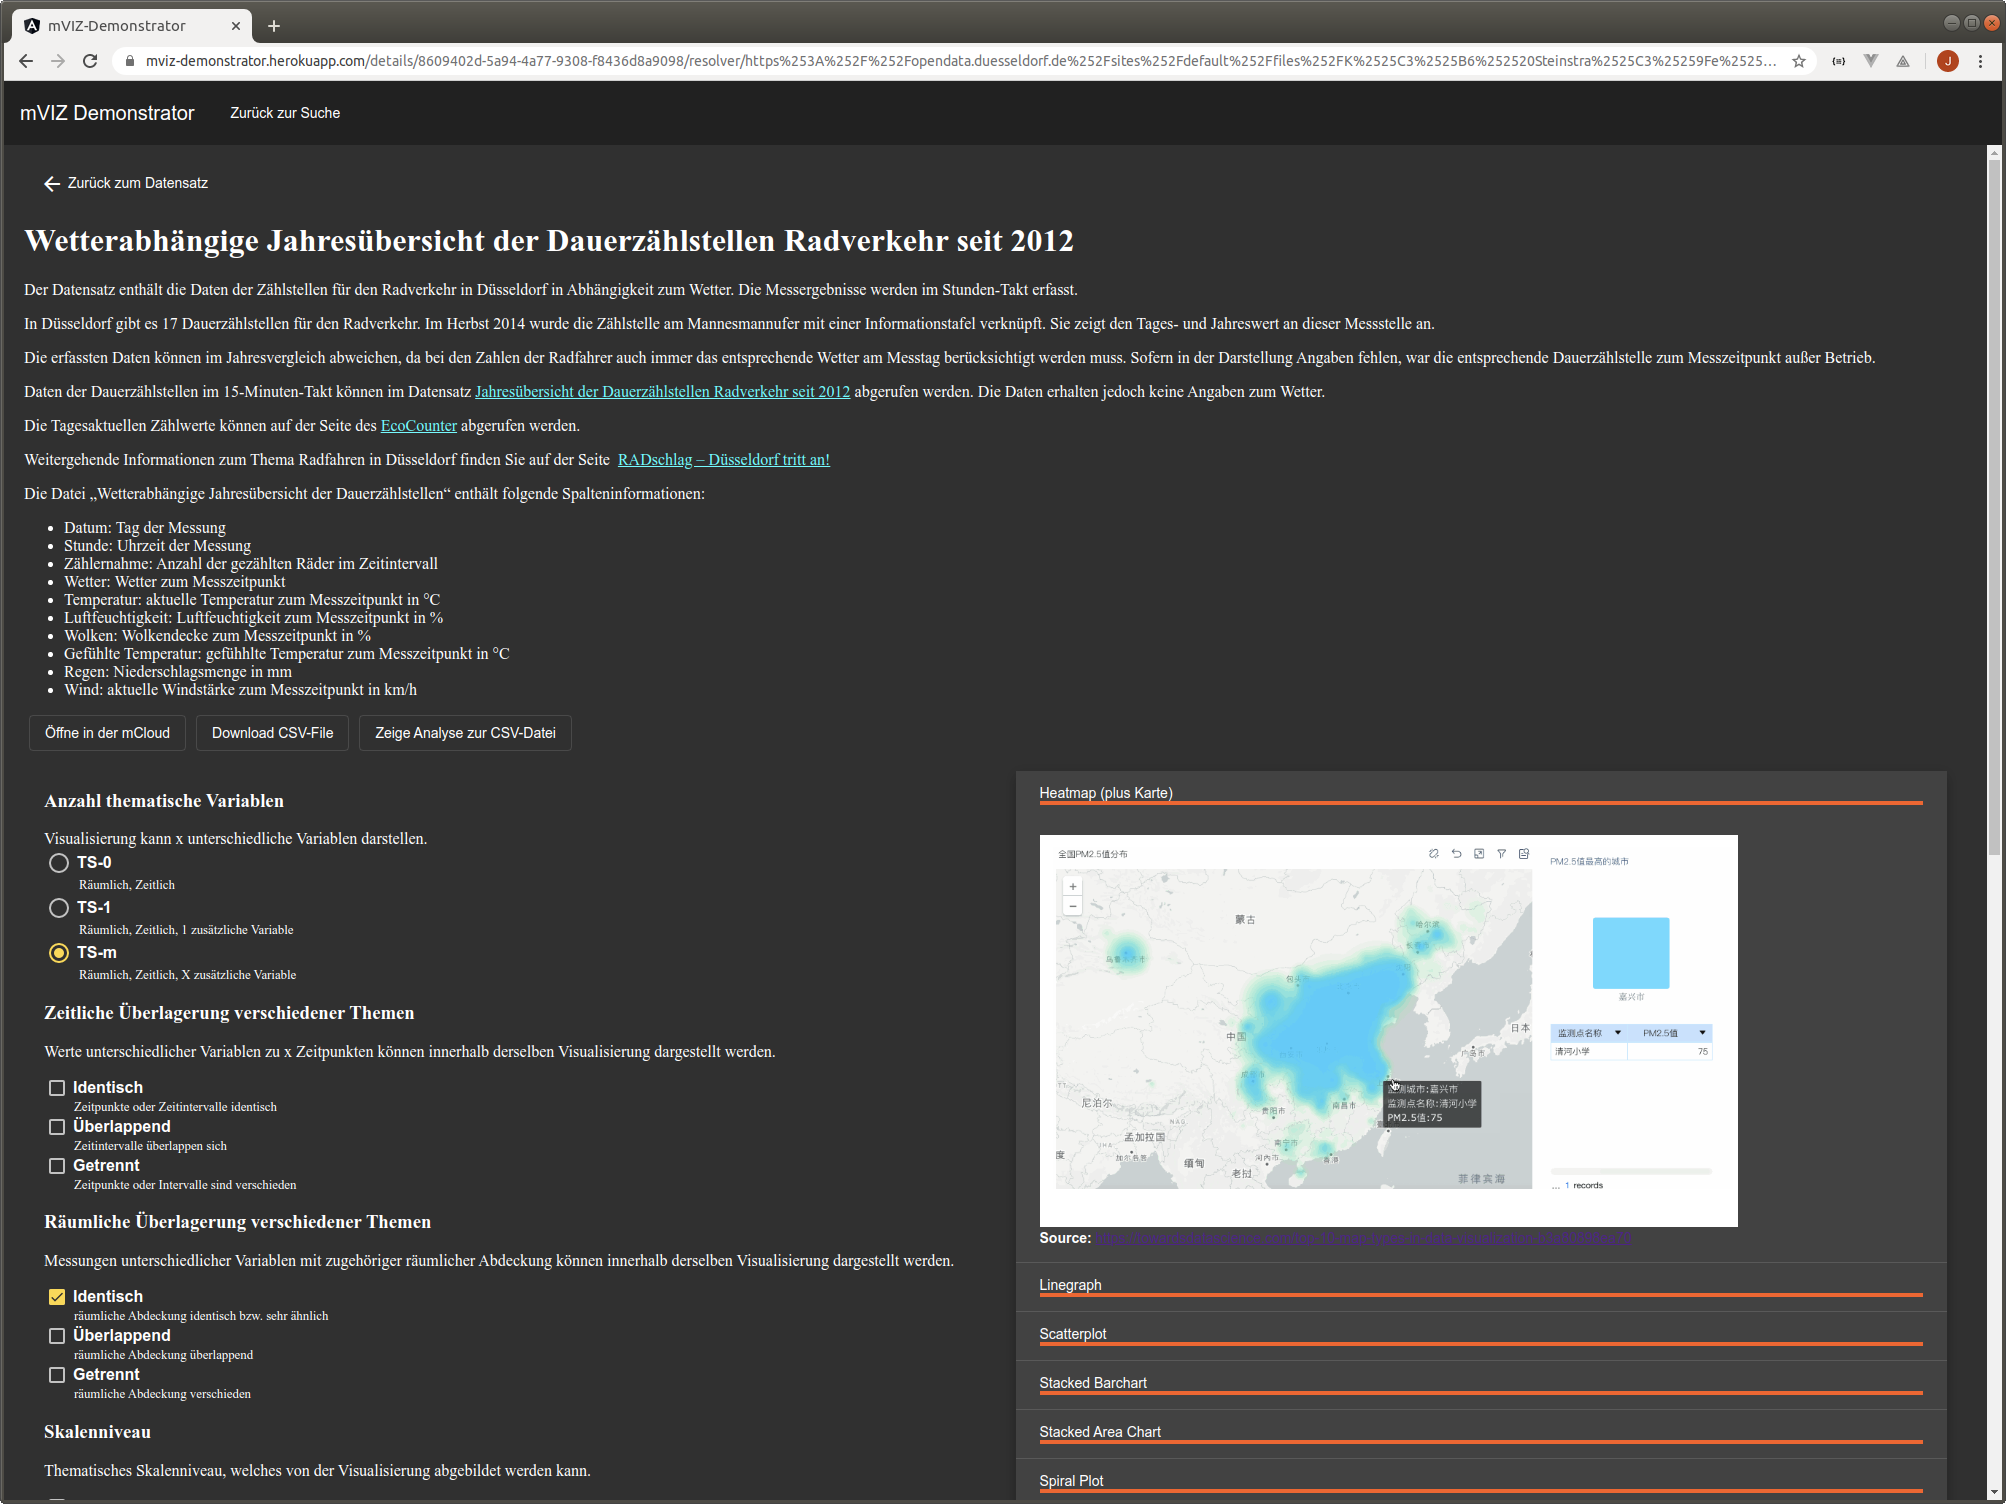
- the development of a demonstrator for supporting the visualization of selected mCLOUD data.
The design and implementation of the demonstrator application was 52°North’s main contribution. We used work from existing tools, such as the Helgoland Sensor Web Viewer.
We also supported the analysis of user requirements, available data sets, and appropriate data visualization approaches. Our experts contributed to the evaluation of approaches for the interoperable integration of open spatio-temporal data sources and provided feedback on design rules for data visualization.
This project was completed in 2020. During this year, we focused on developing a demonstrator that illustrates how to support users as they explore the available spatio-temporal data sets in the mCLOUD. We cooperated with the project partners to enable a full workflow ranging from automated metadata extraction to the presentation of suitable preview visualization options. Furthermore, our team contributed to the best practice guidance document (mVIZ-Leitfaden), which summarizes the most important project findings.
Project Partners
Technische Universität Dresden (TUD), Chair of Geoinformatics, Germany
Beuth Hochschule für Technik Berlin, Germany