
Improving the KomMonitor web client’s look and feel and designing a dashboard
The district of Recklinghausen has been successfully using KomMonitor since 2021. The tool assists municipal departments with evidence-based planning for tasks such as analyzing child care needs, developing housing concepts or creating climate protection strategies. While its initial focus was on displaying and analyzing demographic data, future plans involve integrating additional data, particularly from social and health planning.
The further development aims for significantly improved user-friendliness to better assist professionals in fields such as social services, urban development, and economic development with data-based planning and decision-making. This effort is supported by the district municipalities, particularly the round table of social planners.
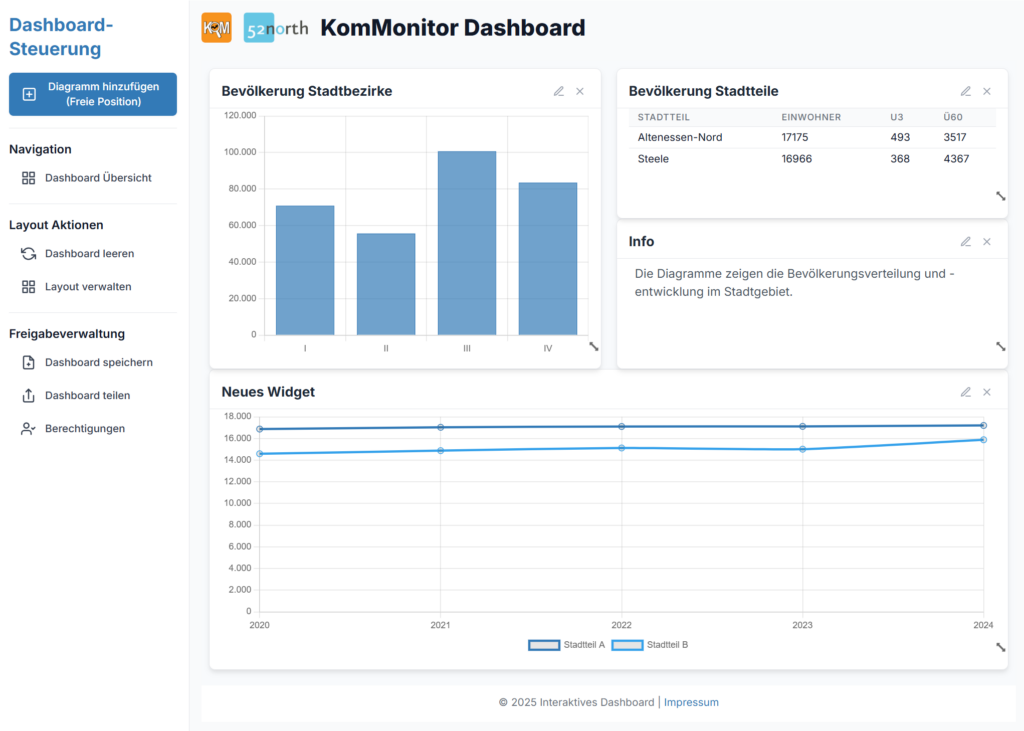
52°North developers significantly refine the KomMonitor user interface. These enhancements focus on improving the frontend’s usability (e.g., in indicator selection), providing a better user experience for accessibility analyses, and streamlining indicator management. Based on a number of user requests, our team developed a concept for a KomMonitor dashboard. This included organizing a workshop with over 30 municipal participants to analyze specific dashboard needs. The outcome was a technical concept and mockups that will serve as the foundation for the dashboard’s upcoming implementation.
Customer
Kreis Recklinghausen, Germany